Running the Intel VTune Profiler on Fedora
TL;DR: This article explains how to install and configure the Intel VTune Profiler on Fedora to use advanced analysis such as the Memory Access tool
The VTune™ Profiler is a well-known commercial performance analysis tool by Intel that targets both Intel and AMD processors on GNU/Linux and Windows. It is popular within the High Performance Computing (HPC) industry and its available for free. You can think about it as an x86-specific complement to Apple Instruments for macOS, which we extensively covered in a previous post.
I recently started to dig into the VTune Profiler for its Memory Access analysis tool to better explore CPU cache issues on a Linux-based benchmark of JSON Toolkit, my high-performance JSON Schema compiler and validator. However, turns out getting the VTune Profiler (and more specifically the Memory Access tool) to work flawlessly on my Fedora system was not a walk in the park. This article aims to document the process in detail for my future-self and others. Note that other GNU/Linux distributions might likely require different installation and configuration procedures. I’m only covering Fedora as my GNU/Linux distribution of choice.
This article is based on Fedora 40 Workstation x86_64, running on a Dell XPS 13”, with Intel VTune Profiler 2024.3.0 (build 628755).
Installing the Intel oneAPI Base Toolkit
While the VTune Profiler is available as a standalone application, it is also included as part of the larger Intel oneAPI Base Toolkit set of developer tools, for which Intel maintains a Fedora repository targeting its DNF package manager. At the time of this writing, you can setup Intel’s DNF repository as follows, though I recommend checking the official installation instructions in case anything changed:
sudo tee /etc/yum.repos.d/oneAPI.repo << EOF
[oneAPI]
name=Intel® oneAPI repository
baseurl=https://yum.repos.intel.com/oneapi
enabled=1
gpgcheck=1
repo_gpgcheck=1
gpgkey=https://yum.repos.intel.com/intel-gpg-keys/GPG-PUB-KEY-INTEL-SW-PRODUCTS.PUB
EOF
Once the repository is configured, you can install the Intel oneAPI Base Toolkit package as follows:
sudo dnf install intel-basekitAdding VTune Profiler to the GNOME application menu
Intel’s DNF packages will install the VTune Profiler purely
within /opt/intel/oneapi/vtune and won’t
automatically register a freedesktop.org
.desktop entry into the standard locations.
Intel does provide a desktop entry at
/opt/intel/oneapi/vtune/latest/bin64/vtune-gui.desktop.
However, it does not register well by symlinking it to the
$HOME/.local/share/applications standard user
entries directory due to its over reliance on relative
paths.
Luckily, its trivial to create a .desktop entry
of our own and load it into the desktop entry database by
running the following commands:
tee "$HOME/.local/share/applications/vtune-gui.desktop" << EOF
[Desktop Entry]
Version=1.0
Type=Application
Name=Intel VTune Profiler
GenericName=VTune
Exec=/opt/intel/oneapi/vtune/latest/bin64/vtune-gui
Terminal=false
Icon=/opt/intel/oneapi/vtune/latest/bin64/resources/app/icons/VTune.png
Categories=Development;
EOF

update-desktop-database "$HOME/.local/share/applications"
If everything went fine, you should start seeing the Intel VTune Profiler icon showing up on the GNOME application menu:

Giving access to Performance Counters
By default, most GNU/Linux installations limit the ability of
processes to monitor and profile other processes for security
reasons. Because profilers like VTune often do need these
capabilities, we need to allow unprivileged processes to
temporarily obtain control over Linux Performance Counters (perf_events)
through the use of the perf_event_open(2)
system call.
We can conveniently enable this on the current session (which
will be reset after a re-boot) through the /proc
filesystem as follows (as root):
echo 0 > /proc/sys/kernel/perf_event_paranoidIf you are curious, according to the documentation, the value 0 corresponds to the following permissions:
scope includes per-process and system wide performance monitoring but excludes raw tracepoints and ftrace function tracepoints monitoring. CPU and system events happened when executing either in user or in kernel space can be monitored and captured for later analysis. Per-user per-cpu
perf_event_mlock_kblocking limit is imposed but ignored for unprivileged processes withCAP_IPC_LOCKcapability.
Note you can do without this permission if you are only performing basic profiling on user-land without taking kernel space into account. However, it is a must to access VTune’s more advanced memory related profiling.
Disabling the Non-Maskable Interrupt watchdog
The Non-Maskable Interrupt (NMI) watchdog is a kernel feature that uses performance monitoring interrupts to detect system hangs by periodically triggering interrupts to ensure the system is responsive. Intel VTune uses performance monitoring interrupts for its analysis, which the NMI watchdog interferes with, and various VTune analysis tools won’t work until the NMI watchdog is disabled.
Same as before, we can conveniently enable this on the
current session (which will be reset after a re-boot) through
the /proc
filesystem as follows (as root):
echo 0 > /proc/sys/kernel/nmi_watchdogLoading VTune’s kernel sampling drivers
Some of the more advanced Intel VTune Profiler analysis tools rely on hardware event-based sampling that requires loading a series of VTune’s kernel modules.
Intel provides pre-built kernel modules for Fedora through
its DNF repository. However, these pre-built kernel modules are
not signed, and Fedora’s kernel is built with the CONFIG_MODULE_SIG_FORCE
option that requires kernel modules to be cryptographically
signed by a X.509 ITU-T standard certificate that is trusted by
the UEFI Secure Boot
installation (for obvious security reasons), making it
impossible to load them out of the box. To solve this, we need
to sign Intel VTune’s kernel modules with a certificate of our
own, and register such self-signed certificate as trusted by
Secure Boot.
Creating a self-signed X.509 certificate
To create our own certificate, we first need to write a X.509
configuration file (named x509-configuration.ini)
that looks like this, making sure to replace the details in the
req_distinguished_name section with your own:
[ req ]
default_bits = 4096
distinguished_name = req_distinguished_name
prompt = no
string_mask = utf8only
x509_extensions = myexts

[ req_distinguished_name ]
O = Juan Cruz Viotti
CN = Sourcemeta
emailAddress = jviotti@sourcemeta.com

[ myexts ]
basicConstraints=critical,CA:FALSE
keyUsage=digitalSignature
subjectKeyIdentifier=hash
authorityKeyIdentifier=keyid
We can then make use of openssl(1) to create a
private and public key as follows:
openssl req -x509 -new -nodes -utf8 -sha256 -days 36500 -batch -outform DER \
  -config path/to/x509-configuration.ini \
  -out my_public_key.der \
  -keyout my_private_key.priv
After running this command, you will have two files you
should securely keep around: my_public_key.der and
my_private_key.priv.
Adding the public key to Secure Boot
Next, we can instruct our machine to trust the
my_public_key.der public key through the use of the
mokutil(1)
utility for managing UEFI Secure Boot Keys as follows (as
root):
mokutil --import path/to/my_public_key.derThe above command will ask for a password that you will need to re-enter on the next book to confirm the trusting of such key. Once you are done, reboot your machine. When booting, you will be presented with a Secure Boot wizard (similar to BIOS) that will walk you through selecting the new public keys to trust and inputting their corresponding passwords.
Signing the kernel modules
Once the public key we created is trusted by Secure Boot, we
can proceed to sign the kernel modules. The Linux kernel itself
comes with a sign_file
utility program that you can access on Fedora at the following
location:
/usr/src/kernels/$(uname -r)/scripts/sign-fileThis program takes as arguments the hash algorithm (in this
case we want sha256), the private and public keys
we created before, and the file to sign. We will sign all of the
required VTune kernel modules as follows:
sudo /usr/src/kernels/$(uname -r)/scripts/sign-file \
  sha256 path/to/my_private_key.priv path/to/my_public_key.der \
  /opt/intel/oneapi/vtune/latest/sepdk/src/sep5-x32_64-$(uname -r)smp.ko

sudo /usr/src/kernels/$(uname -r)/scripts/sign-file \
  sha256 path/to/my_private_key.priv path/to/my_public_key.der \
  /opt/intel/oneapi/vtune/latest/sepdk/src/pax/pax-x32_64-$(uname -r)smp.ko

sudo /usr/src/kernels/$(uname -r)/scripts/sign-file \
  sha256 path/to/my_private_key.priv path/to/my_public_key.der \
  /opt/intel/oneapi/vtune/latest/sepdk/src/vtsspp/vtsspp-x32_64-$(uname -r)smp.ko

sudo /usr/src/kernels/$(uname -r)/scripts/sign-file \
  sha256 path/to/my_private_key.priv path/to/my_public_key.der \
  /opt/intel/oneapi/vtune/latest/sepdk/src/socperf/src/socperf3-x32_64-$(uname -r)smp.ko

sudo /usr/src/kernels/$(uname -r)/scripts/sign-file \
  sha256 path/to/my_private_key.priv path/to/my_public_key.der \
  /opt/intel/oneapi/vtune/latest/sepdk/src/socwatch/drivers/socwatch2_15-x32_64-$(uname -r)smp.ko
Loading the kernel modules
Now we ready to attempt to load the kernel modules, which we can do through a utility shell script shipped with Intel VTune as follows.
sudo /opt/intel/oneapi/vtune/latest/sepdk/src/insmod-sep --reload --group $(whoami)The --group option makes the kernel modules
accessible for your user without additional user group
configuration. Otherwise, the default is the vtune
group and you will need to manually add your user to such
group.
Running Intel VTune Profiler
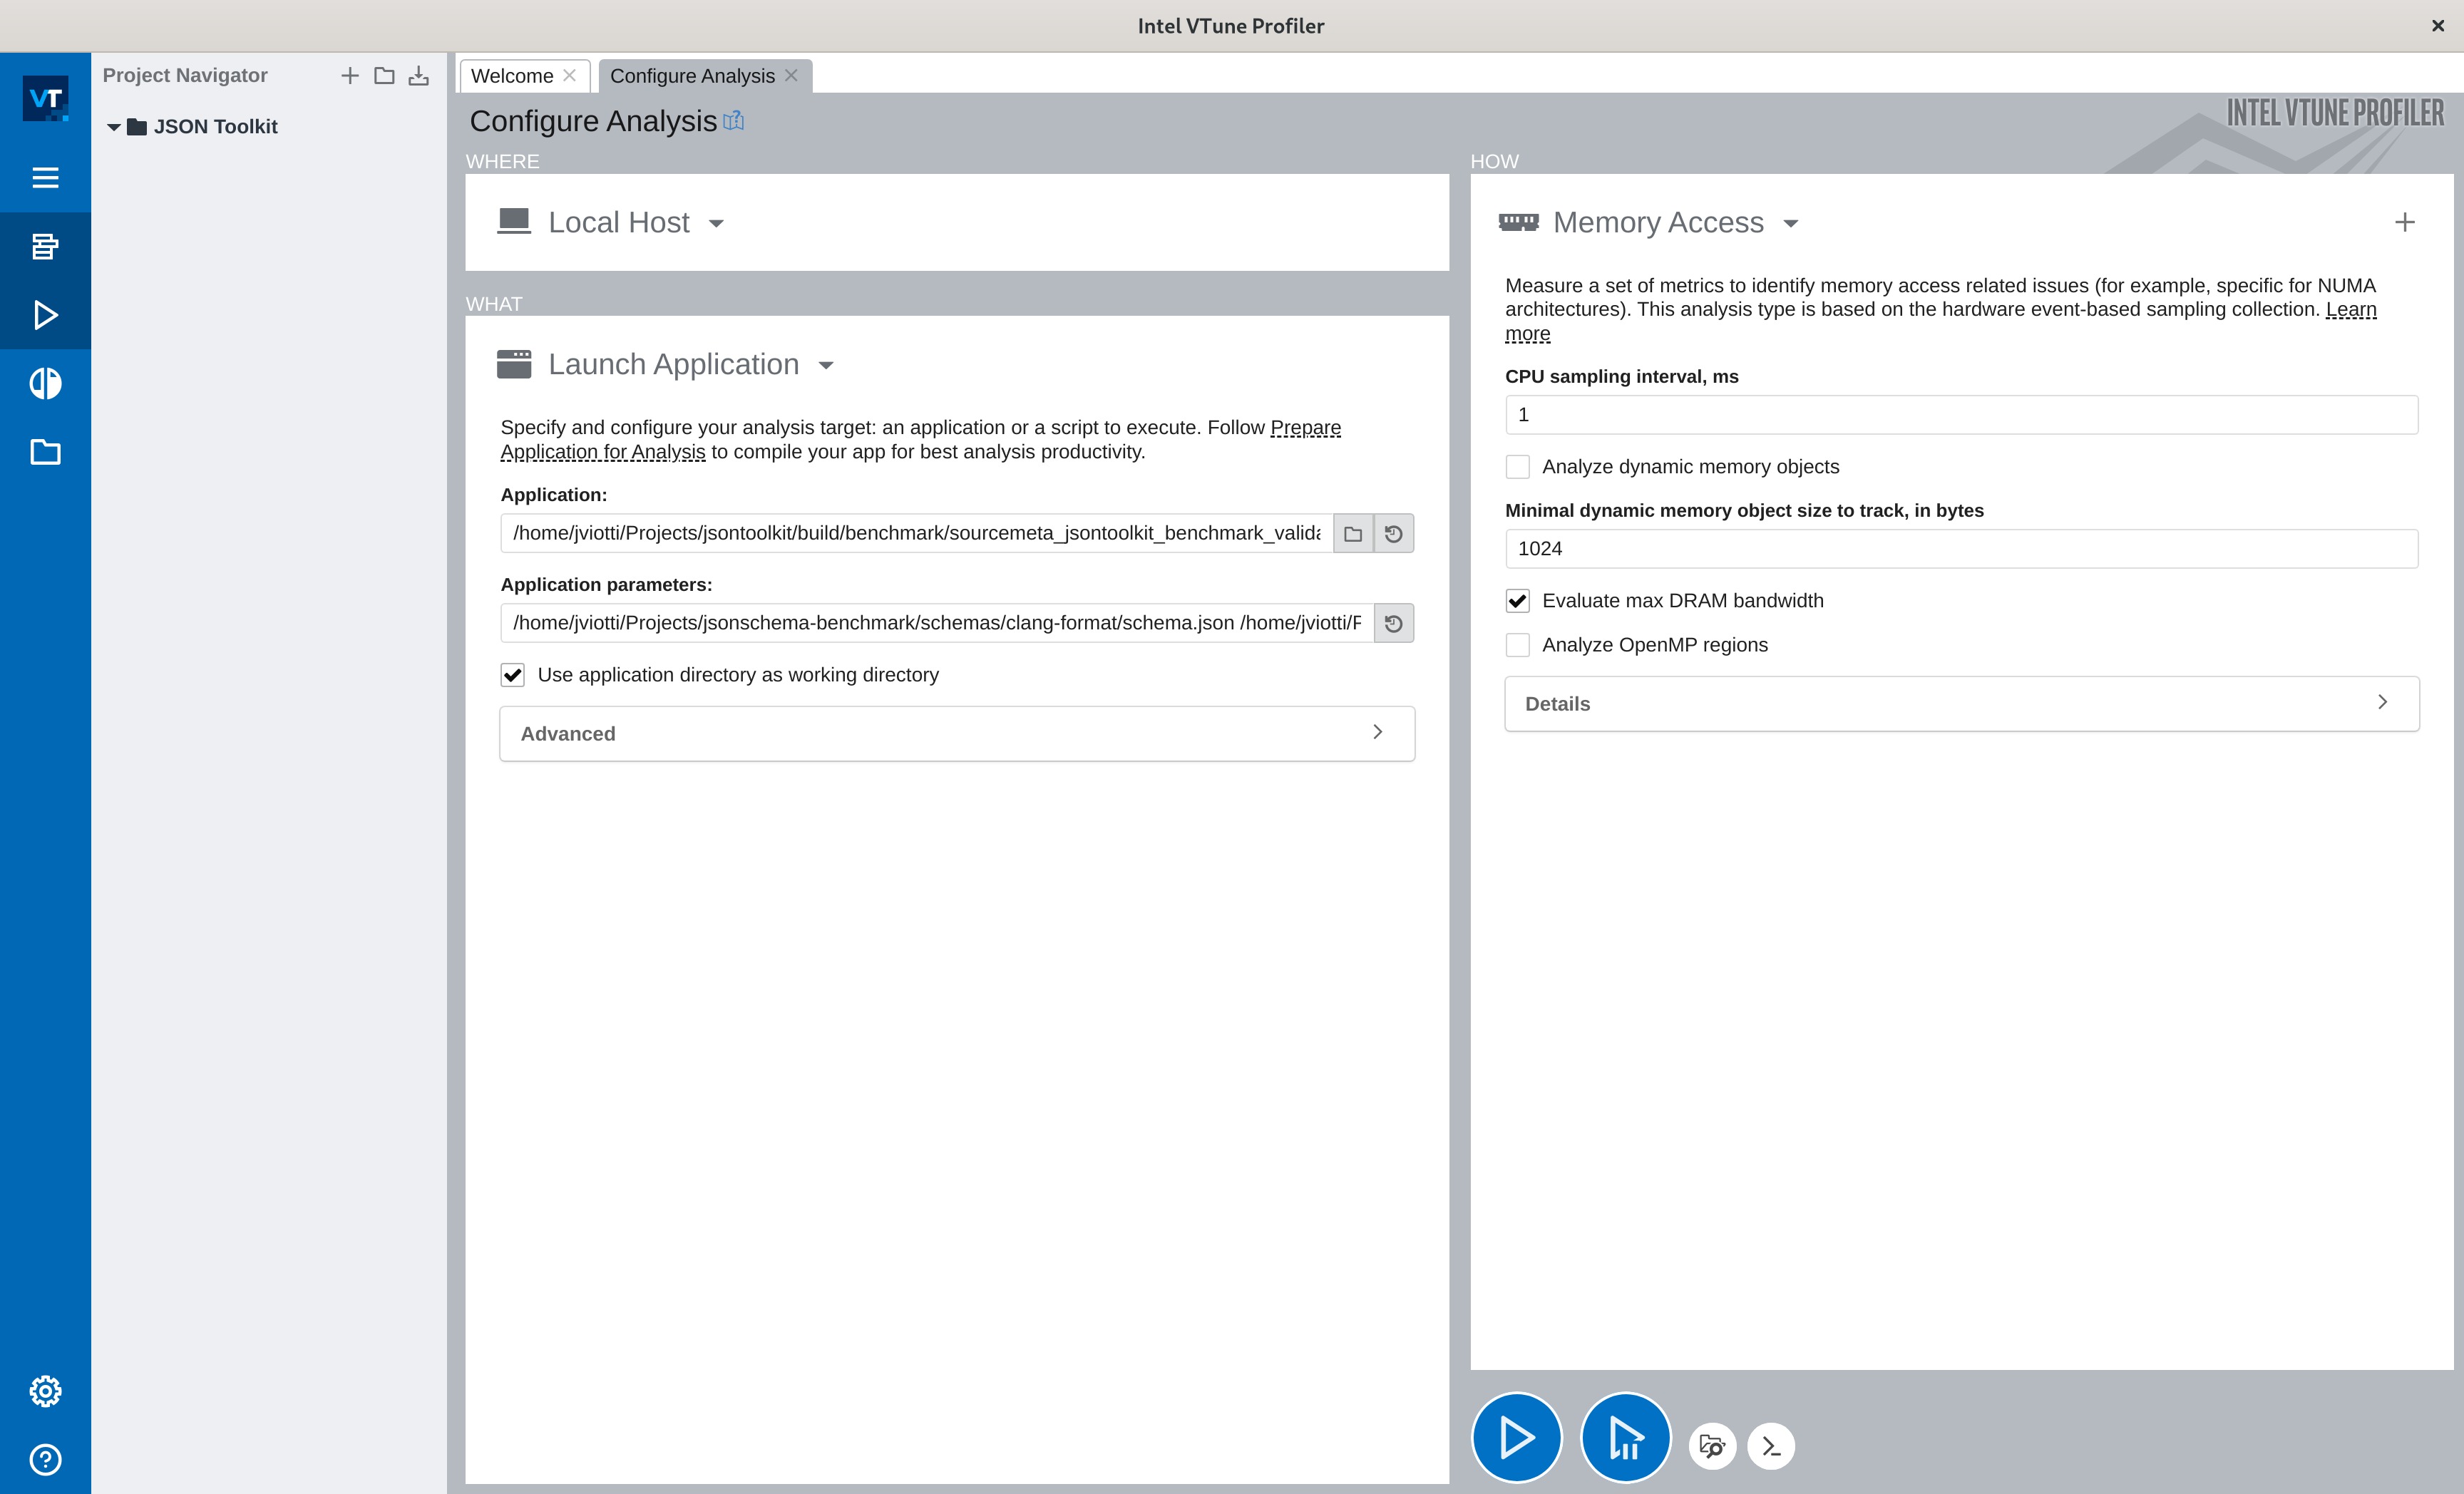
If everything went well, you should be able to run the VTune Profiler, and configure an analysis session with the Memory Access tool without facing any warnings:
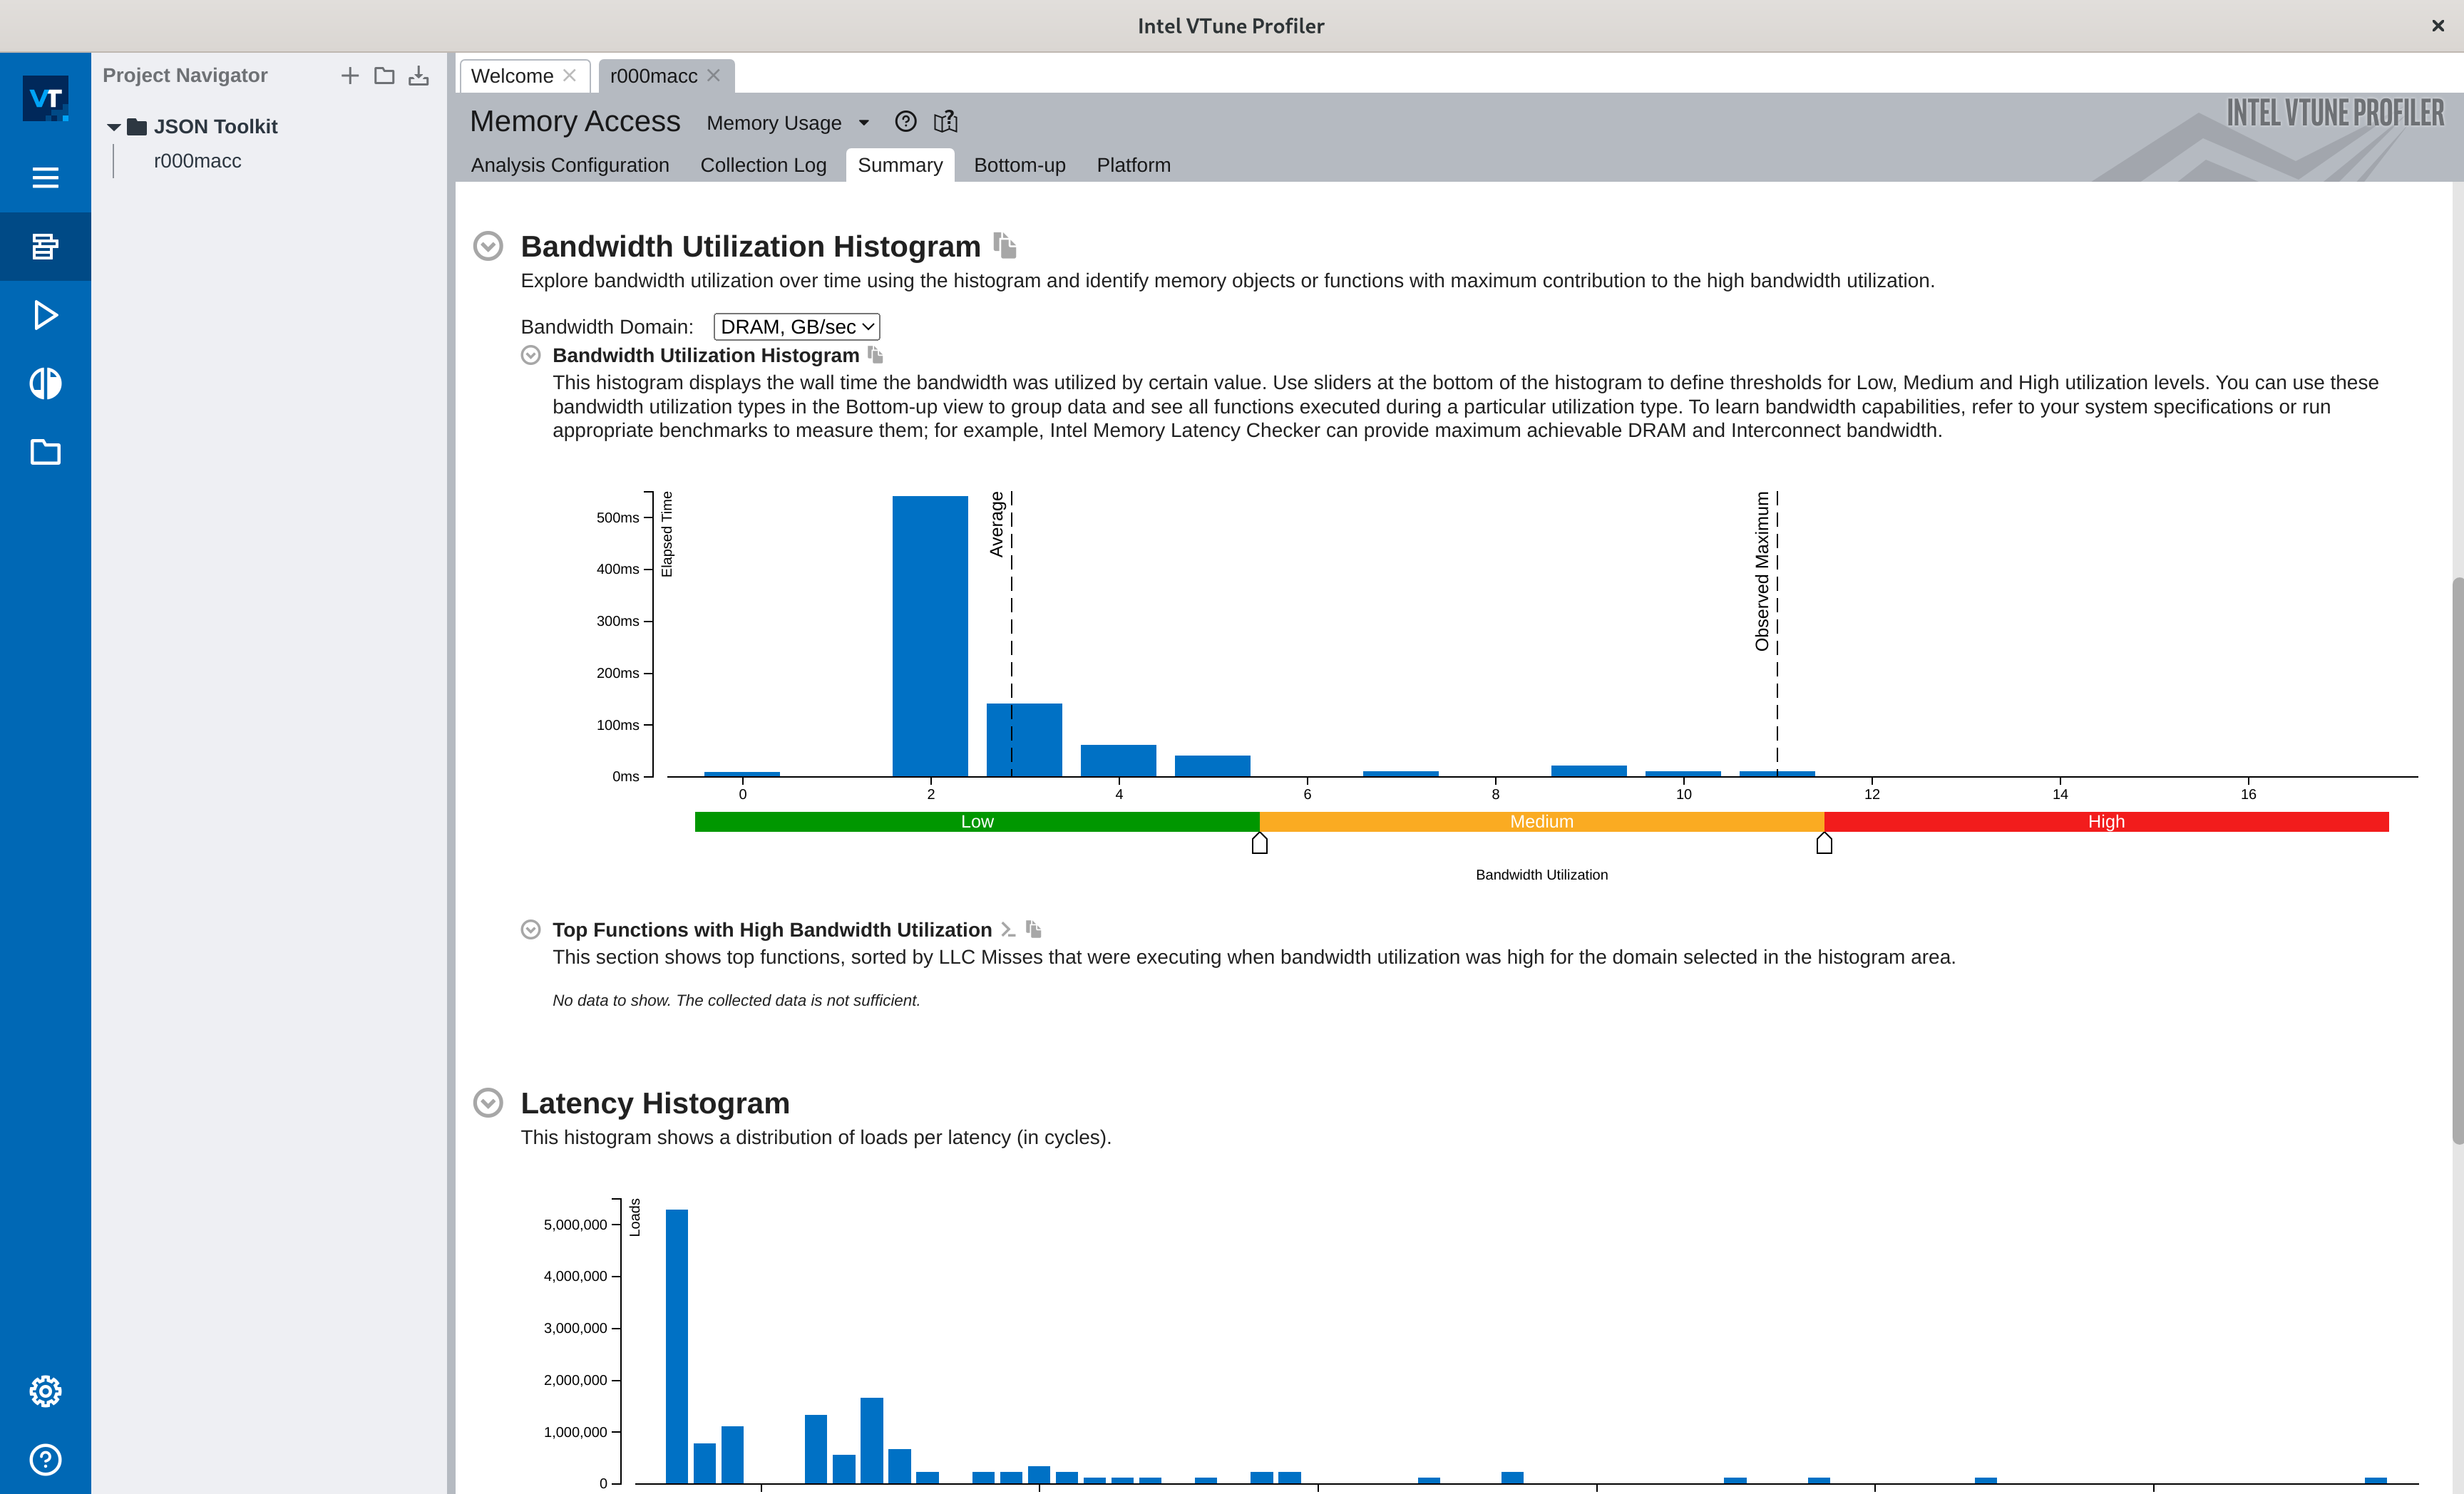
Hitting play and waiting a bit should present you with the memory analysis we were looking for: