Studying C++ generated assembly using Xcode Instruments
TL;DR: A short guide to studying the assembly code generated by AppleClang for C++ projects using Xcode Instruments
One of the most essential parts of C++ performance-oriented work is understanding what’s going on under the hood. Popular ways of doing so on macOS that I wrote about in the past include profiling (see Using Xcode Instruments for C++ CPU profiling), step-through debugging (see Debugging the C++ standard library on macOS), and taking advantage of tooling that your compiler toolchain ships with (see Understanding Objective-C by transpiling it to C++).
This article is a brief instruction on how to to easily inspect and study the assembly code that AppleClang generates for C++ on macOS using Xcode Instruments, which is built on top of Apple LLVM toolchain. Similar results (though harder to read), can be obtained using LLDB.
This article makes use of Xcode 16.2 running on macOS Sequoia 15.3 on a 2023 M3 Pro MacBook Pro.
Release builds and debug symbols
Any performance analysis involves studying the stripped and optimised code that end users will run in production. The problem is that release builds may perform aggressive inlining and code transformations, making it hard or impossible to correlate the generated assembly back to the original portions of the code you care about.
The solution (at least to a great extent) is to produce
release builds with debug information. On LLVM, this is
accomplished by setting the desired optimisation levels (such as
with the -O3 option) while also generating
debugging symbols (with the -g option). On macOS,
AppleClang will usually generate *.dSYM DWARF symbol
directories alongside binaries that debugging tools such as LLDB
will pick up out of the box. For example:
$ clang++ -std=c++20 -O3 -g hello.c -o hello
$ file hello
hello: Mach-O 64-bit executable arm64
$ file hello.dSYM
hello.dSYM: directory
CMake and single-configuration generators
If you are using CMake with
single-configuration generators (like Makefiles or Ninja), the
standard approach is to configure the project with the CMAKE_BUILD_TYPE
option set to RelWithDebInfo. As its name implies,
this build type corresponds to a release build with debug
information.
Note that as of CMake 3.31, RelWithDebInfo
defaults to a -O2 optimisation level that differs
from the -O3 optimisation level chosen by the
Release build type, which can lead to differences
in the generated assembly. This can be overriden by manually
specifying the
-DCMAKE_CXX_FLAGS_RELWITHDEBINFO="-O3 -g" argument
when configuring the project.
By default, CMake seems to prefer embedding debug symbols into the resulting binary rather that extracting them into
*.dSYMdirectories. The outcome is the same, and if desired, symbols can be manually extracted into*.dSYMdirectories using thedsymutil(1)tool.
CMake and multi-configuration generators
In comparison to single-configuration generators,
multi-configuration generators tend to ignore the
CMAKE_BUILD_TYPE option and delegate the build type
selection to the generator.
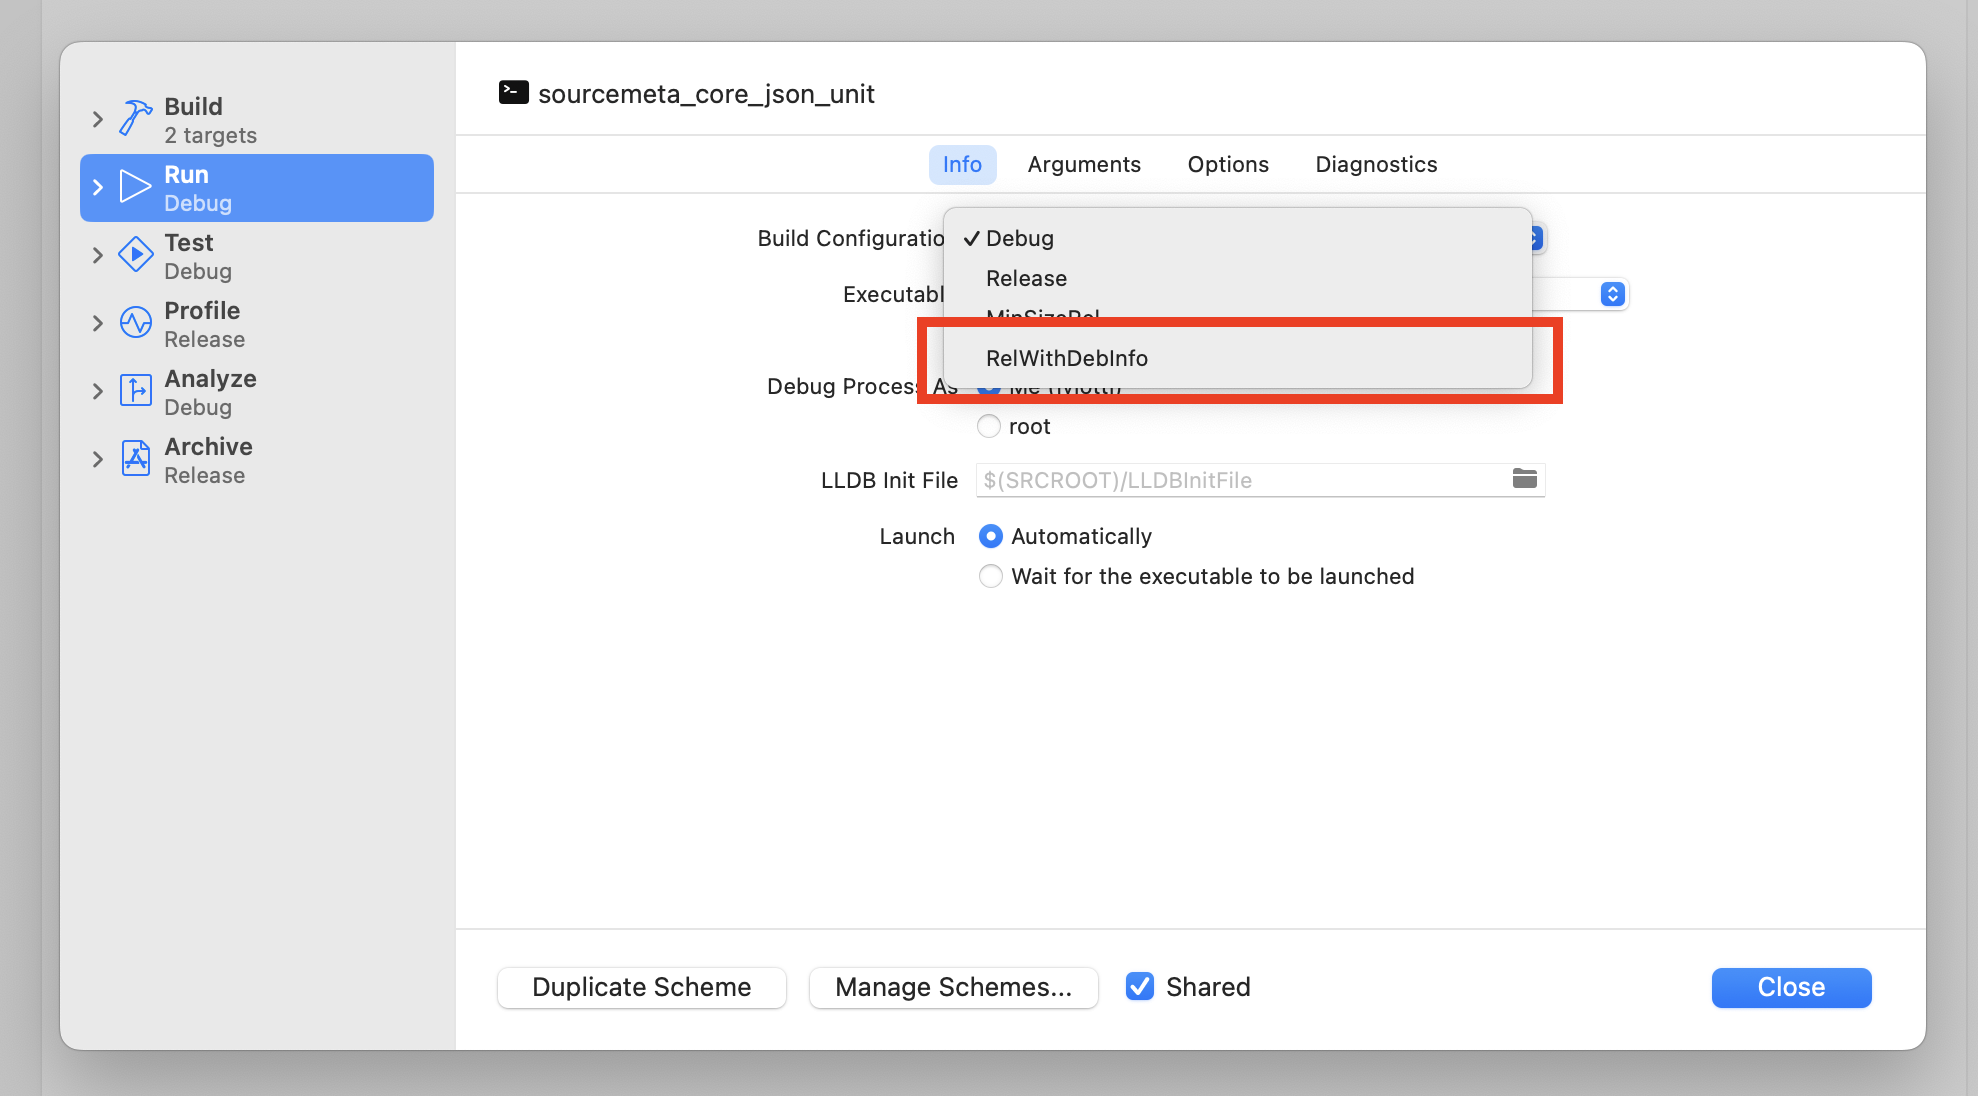
When using the Xcode generator, the build type is configured
by going to
Product -> Scheme -> Edit Schema..., and
selecting RelWithDebInfo from the
Build Configuration setting in the
Info tab. For other multi-configuration generators,
you may need to consult the corresponding documentation.
Using Google Benchmark as the analysis driver
Assuming you are working on performance, you are likely already measuring the code you are about using a benchmark library like Google Benchmark, making the benchmark runner the perfect vehicle for inspecting the generated assembly without the additional noise of a full-blown application release.
Let’s take my Sourcemeta Core
C++ library as an example. We will focus on the
sourcemeta::core::JSON::fast_hash() method that
aims to quickly compute a 64-bit hash out of a JSON document. I
have a Google Benchmark case covering this method called
JSON_Fast_Hash_Helm_Chart_Lock. As its name
implies, it attempts to compute a fast hash out of a sample JSON
document that corresponds to a Helm Chart
.lock file. This benchmark case can be
individually executed as follows:
# Clone and build the project (if you want to follow along)
$ git clone https://github.com/sourcemeta/core
$ make -C core PRESET=RelWithDebInfo

# Execute the benchmark case
$ ./core/build/benchmark/sourcemeta_core_benchmark --benchmark_filter=JSON_Fast_Hash_Helm_Chart_Lock
...
-------------------------------------------------------------------------
Benchmark                               Time             CPU   Iterations
-------------------------------------------------------------------------
JSON_Fast_Hash_Helm_Chart_Lock       64.0 ns         64.0 ns     10904616
Profiling the benchmark case with Xcode Instruments
Let’s run the JSON_Fast_Hash_Helm_Chart_Lock
Google Benchmark case over Xcode Instruments using the
xctrace command-line tool, store the profiling
result as output.trace, and open the report using
the Xcode Instruments graphical application.
$ xcrun xctrace record \
  --template 'CPU Profiler' \
  --no-prompt \
  --output output.trace \
  --target-stdout - \
  --launch -- \
  ./core/build/benchmark/sourcemeta_core_benchmark \
    --benchmark_filter=JSON_Fast_Hash_Helm_Chart_Lock \
    --benchmark_min_time=10s

$ open output.trace
Note that I’m passing the
--benchmark_min_time=10s option to Google Benchmark
to run the benchmark case for at least 10 seconds. This is to
give the Xcode Instruments sampler a chance to get more
information about the program execution. While this is not
strictly needed to analyse the generated assembly code, it lets
Xcode Instruments highlight the specific assembly instructions
that take more time to execute.
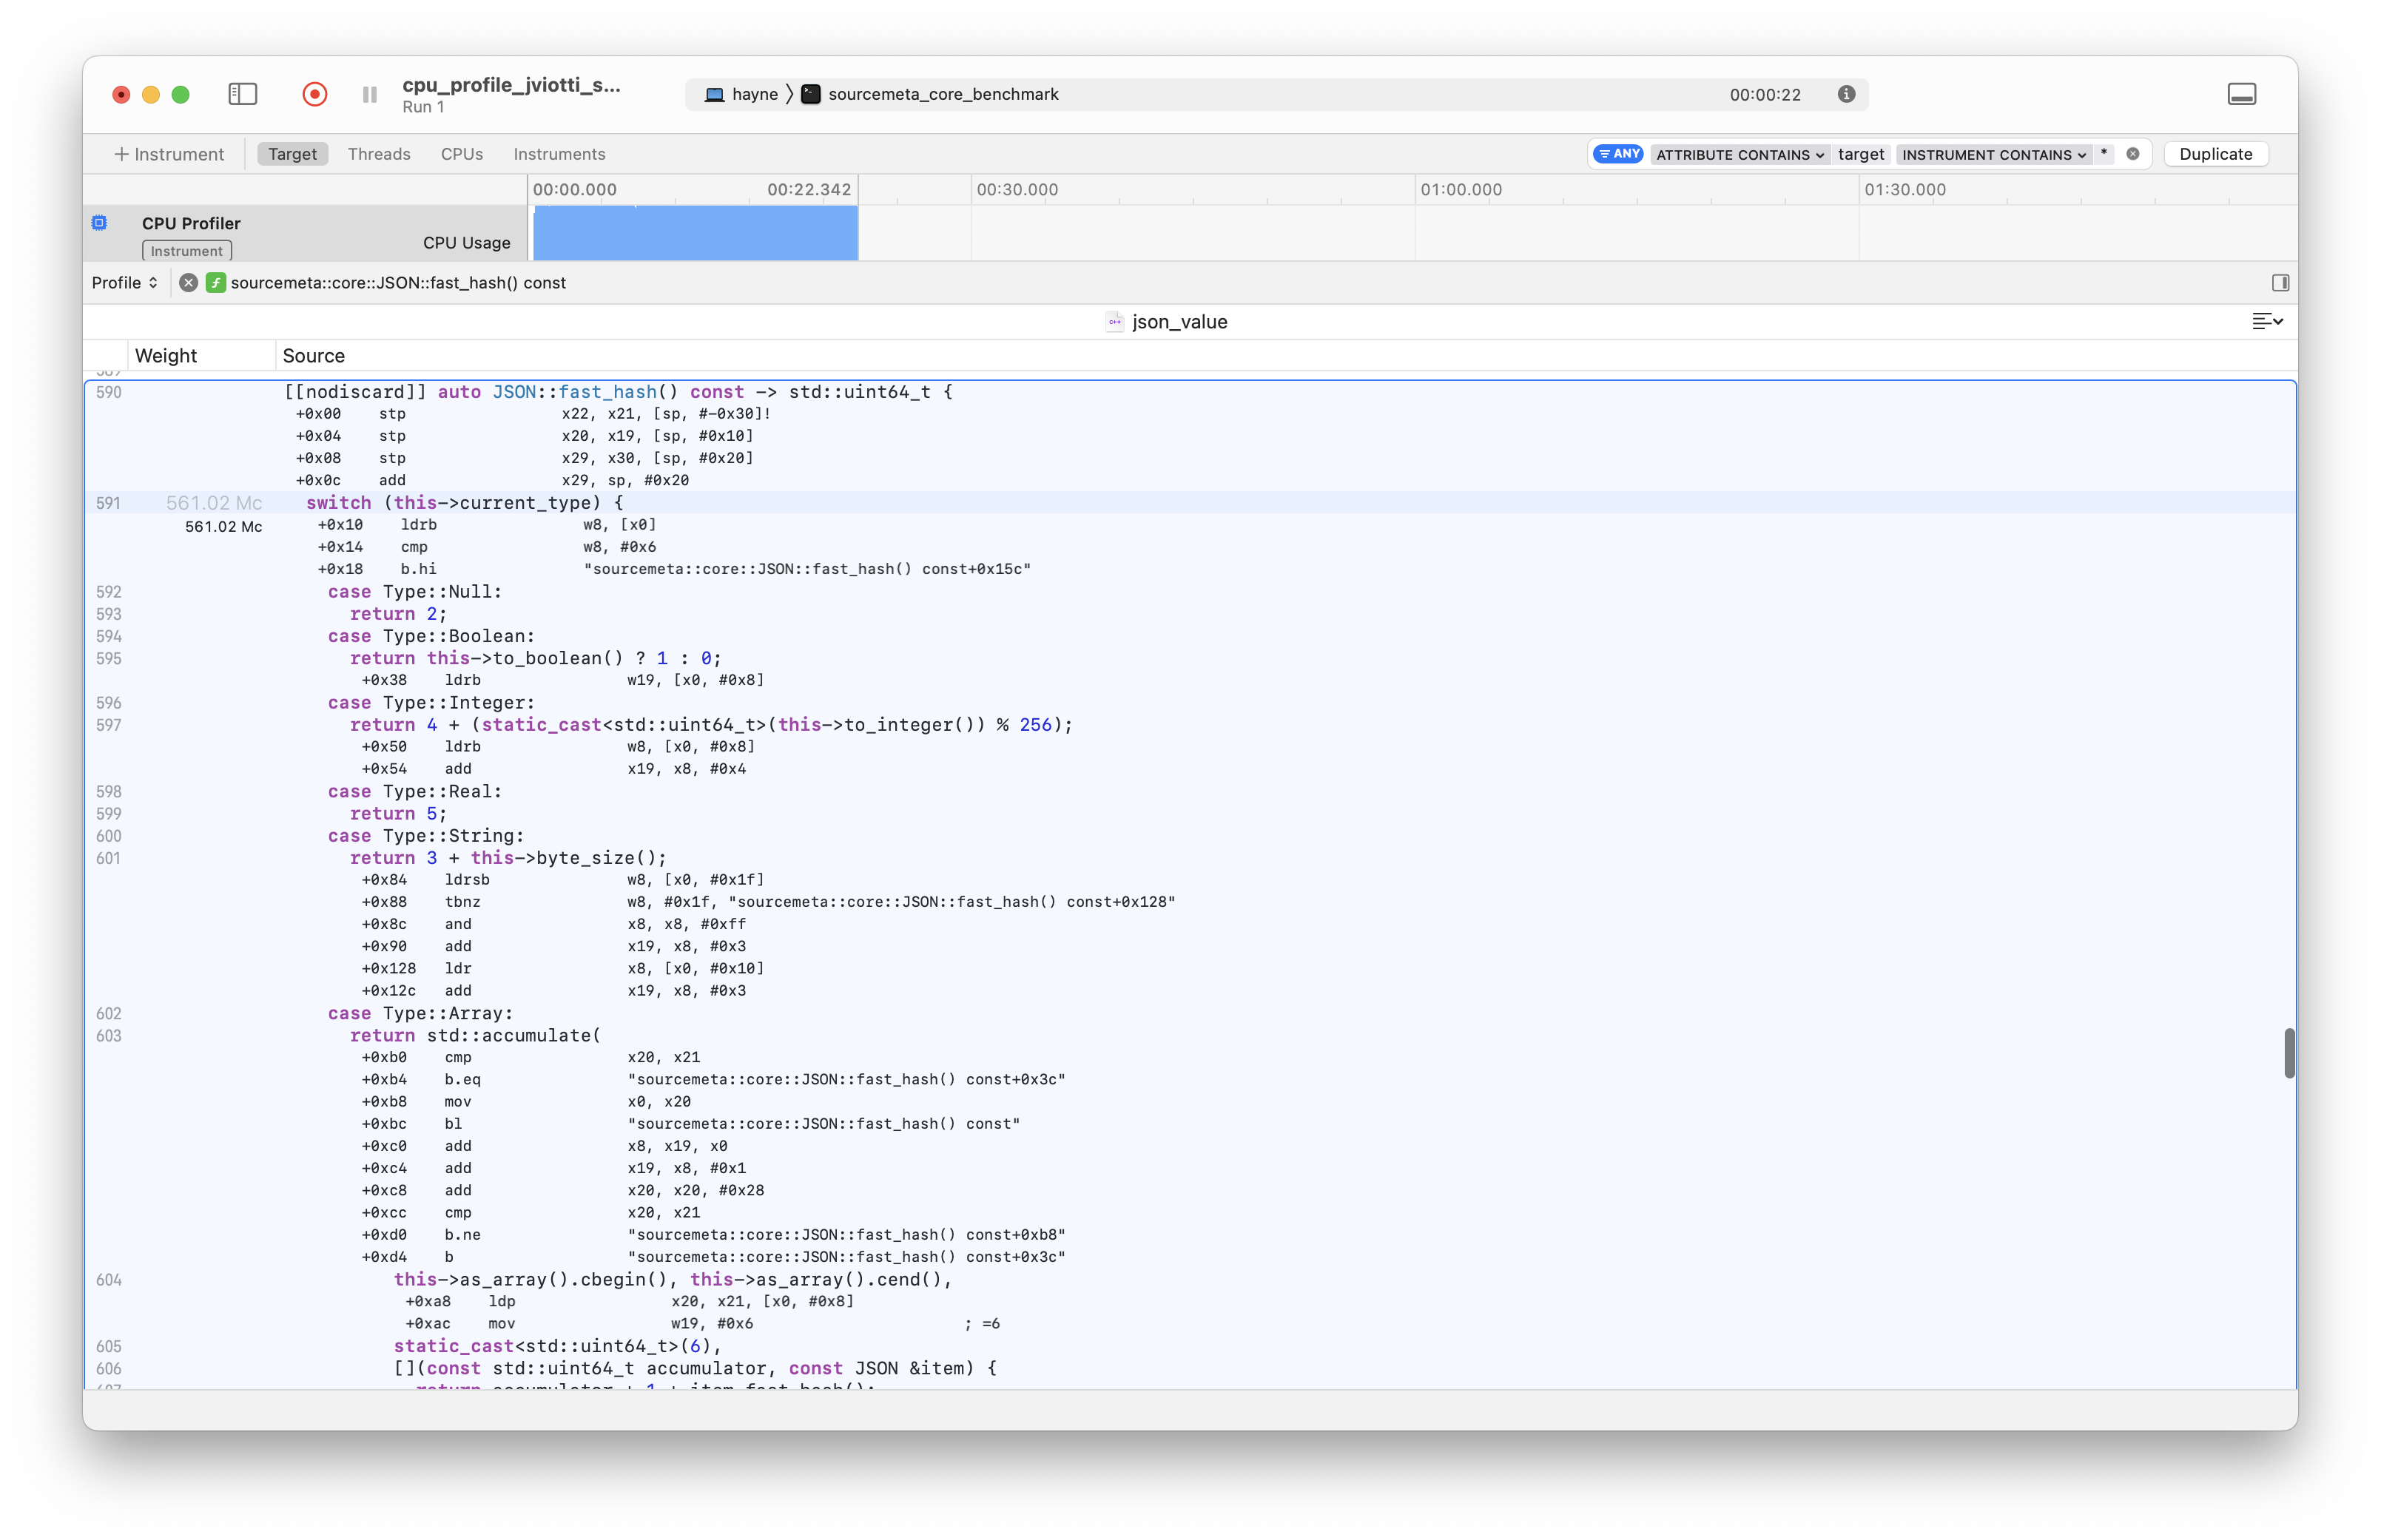
The Xcode Instruments “Interleave” view
Now that we have a CPU profile, we can select the frame that
corresponds to sourcemeta::core::JSON::fast_hash.
Double-clicking on it will make Xcode Instruments present the
method in its source code view. If you click the settings icon
at the top right of the source code pane, you will be presented
a few options, including one called “Interleave”.

Selecting the “Interleave” view mode will result in the generated assembly code being visible alongside the C++ code, making it trivial to study further. Additionally, because we let the profiler sample for 10 seconds, we get information about the associated weight of invidual assembly instructions.
Annex: Interleaved disassembling using LLDB
If a proprietary graphical desktop application like Xcode Instruments is not your cup of tea, you can also inspect generated assembly in an interleaved manner using LLDB. While this approach is more flexible (and applicable to other platforms where the LLVM toolchain works), I find it much harder to read. That said, let’s get into it.
First, we will load the same Google Benchmark case using LLDB.
$ lldb ./build/benchmark/sourcemeta_core_benchmark -- --benchmark_filter=JSON_Fast_Hash_Helm_Chart_Lock
(lldb) target create "./build/benchmark/sourcemeta_core_benchmark"
Current executable set to '/Users/jviotti/Projects/core/build/benchmark/sourcemeta_core_benchmark' (arm64).
(lldb) settings set -- target.run-args  "--benchmark_filter=JSON_Fast_Hash_Helm_Chart_Lock"
Then, we will add a breakpoint in the
sourcemeta::core::JSON::fast_hash method and run
the target. As expected, execution will pause on the
corresponding method.
(lldb) breakpoint set --file json_value.cc --line 590
Breakpoint 1: where = sourcemeta_core_benchmark`sourcemeta::core::JSON::fast_hash() const at json_value.cc:590, address = 0x0000000100069ffc

(lldb) run
...
* thread #1, queue = 'com.apple.main-thread', stop reason = breakpoint 1.1
    frame #0: 0x0000000100069ffc sourcemeta_core_benchmark`sourcemeta::core::JSON::fast_hash(this=0x000000016fdfd840) const at json_value.cc:590 [opt]
   587    }
   588  }
   589
-> 590  [[nodiscard]] auto JSON::fast_hash() const -> std::uint64_t {
   591    switch (this->current_type) {
   592      case Type::Null:
   593        return 2;
Target 0: (sourcemeta_core_benchmark) stopped.
warning: sourcemeta_core_benchmark was compiled with optimization - stepping may behave oddly; variables may not be available.
Once there, we can use the disassemble command
with the --mixed argument to get LLDB to
disassemble the current frame alongside its source code. The
outcome is similar to what Xcode Instruments presents you,
though potentially a bit harder to read!
(lldb) disassemble --mixed --kind
sourcemeta_core_benchmark`sourcemeta::core::JSON::fast_hash:
->  0x100069ffc <+0>:   unknown     stp    x22, x21, [sp, #-0x30]!
    0x10006a000 <+4>:   unknown     stp    x20, x19, [sp, #0x10]
    0x10006a004 <+8>:   unknown     stp    x29, x30, [sp, #0x20]
    0x10006a008 <+12>:  unknown     add    x29, sp, #0x20

** 591    switch (this->current_type) {
   592      case Type::Null:
   593        return 2;

    0x10006a00c <+16>:  unknown     ldrb   w8, [x0]
    0x10006a010 <+20>:  unknown     cmp    w8, #0x6
    0x10006a014 <+24>:  unknown     b.hi   0x10006a158    ; <+348> at json_value.cc:619:7
    0x10006a018 <+28>:  unknown     mov    w19, #0x2 ; =2
    0x10006a01c <+32>:  unknown     adrp   x9, 119
    0x10006a020 <+36>:  unknown     add    x9, x9, #0xd83 ; typeinfo name for std::__1::bad_function_call + 81
    0x10006a024 <+40>:  unknown     adr    x10, 0x10006a034 ; <+56> [inlined] sourcemeta::core::JSON::to_boolean() const at json_value.cc:396:16
    0x10006a028 <+44>:  unknown     ldrb   w11, [x9, x8]
    0x10006a02c <+48>:  unknown     add    x10, x10, x11, lsl #2
    0x10006a030 <+52>:  unknown     br     x10

   394  [[nodiscard]] auto JSON::to_boolean() const noexcept -> bool {
   395    assert(this->is_boolean());
** 396    return this->data_boolean;
   397  }
   398

    0x10006a034 <+56>:  unknown     ldrb   w19, [x0, #0x8]

   620        return 0;
   621    }
** 622  }
   623

# Truncated for conciseness
[...]